Model building is central to an analyst’s workflow. The model informs buy/sell decisions, reveals trends in revenue distribution and capital allocation, and paints a picture of the financial performance of a company. For strategists and investor relations professionals, financial models provide a way to benchmark their company’s performance and reporting methodology with that of their peers or competitors.
Normally, to build a model from scratch (for a public company), you’d have to find all Ks or Qs for the time period of interest, then manually copy, format, and structure the table data from each of these Ks and Qs into one Excel sheet. The process is tedious, manual, and painstaking.
Related Reading: Conduct Fast, Accurate Analysis With Advanced Financial Modeling
Meet the table tools suite
We’ve condensed the entire model building process into minutes. Build models and form analyses faster with the new table tools suite:
- Table Modeling — export modeled time-series data QoQ or YoY on balance sheets, income statements, and cash-flow statements–from 10Ks/Qs and 8Ks.
- Table Extraction — extract and export any table from SEC filings and broker research to Excel for further analysis and manipulation.
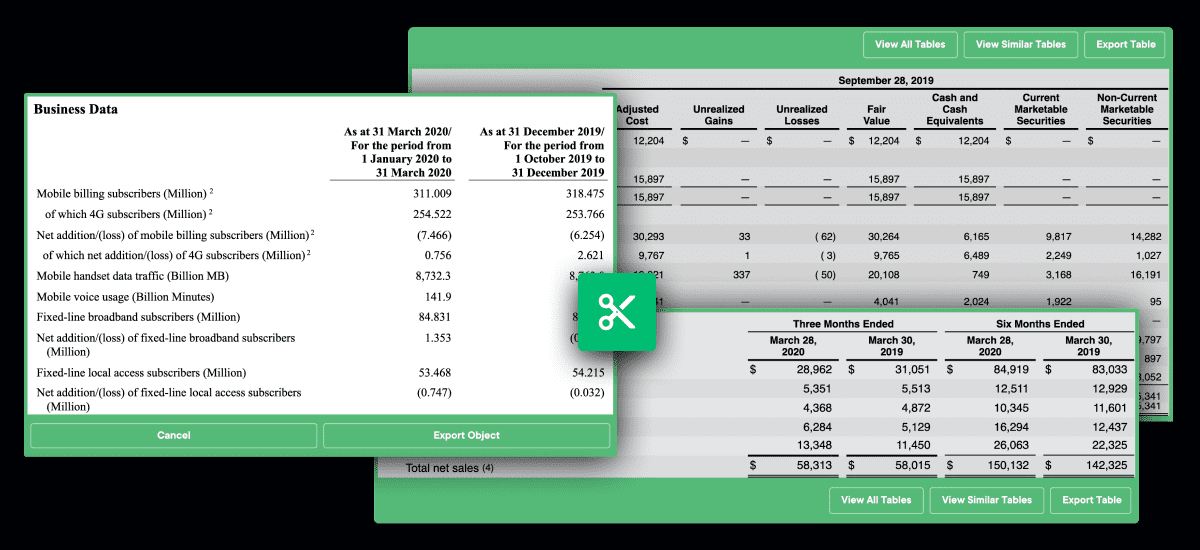
- [New] Table Clipper — clip tables and charts into Excel from company presentations, global filings, and ESG reports to include them in your analyses and presentations.
Use modeling to accelerate earnings & competitive analysis
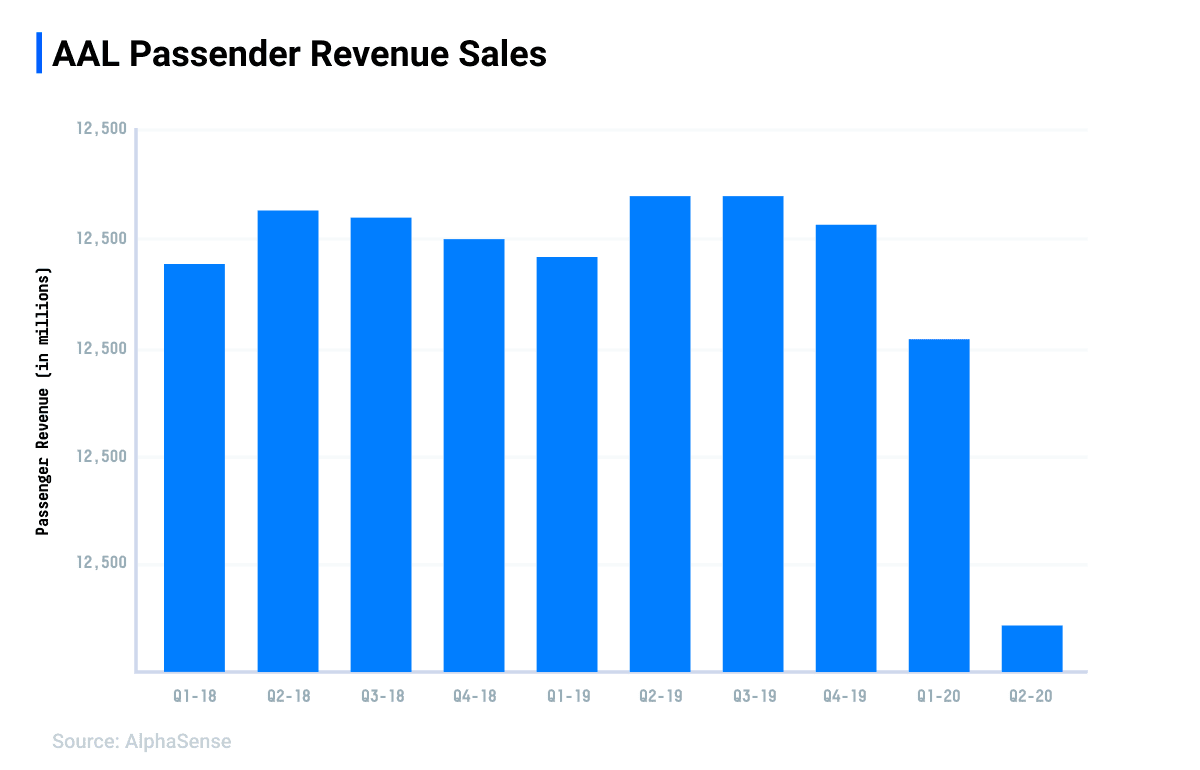
Let’s dive into American Airlines’ revenue for the past two years and see how COVID-19 has materially impacted passenger sales revenue.
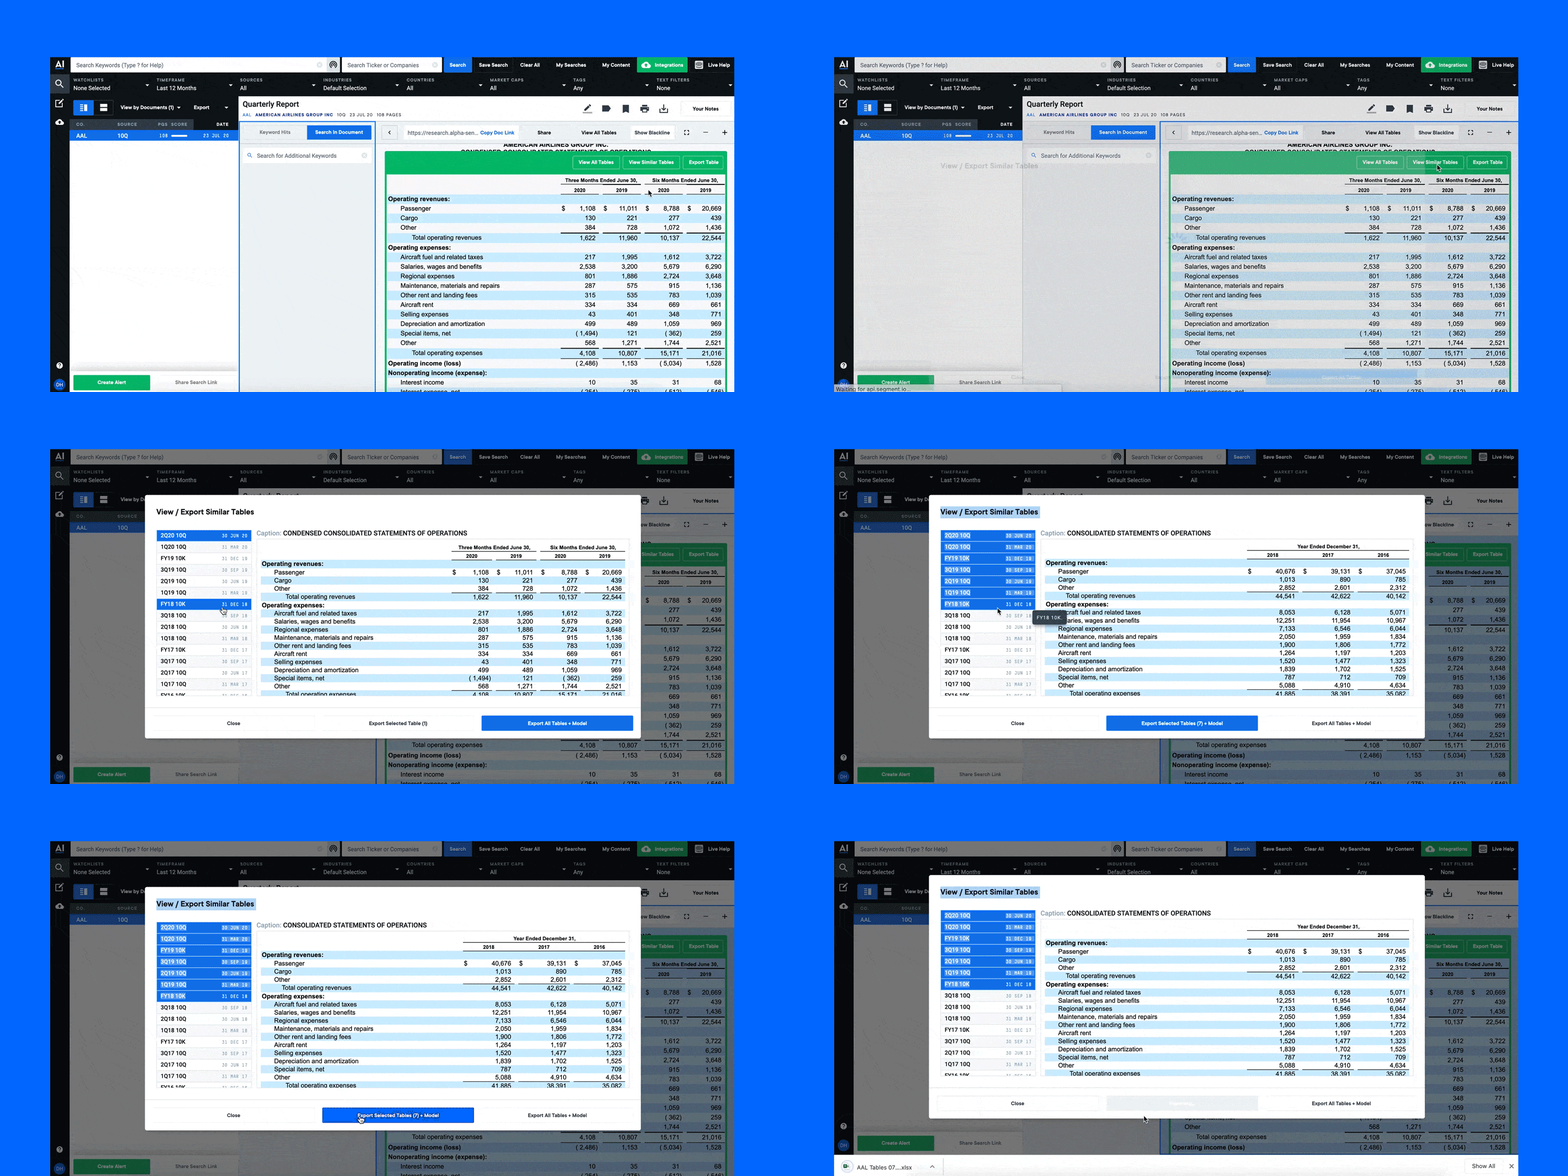
Using our table matching algorithm, table modeling first surfaces similar tables from past quarters, then matches each line item in the table to match rows of previous quarters. After selecting multiple periods of time, export the modeled data to Excel.
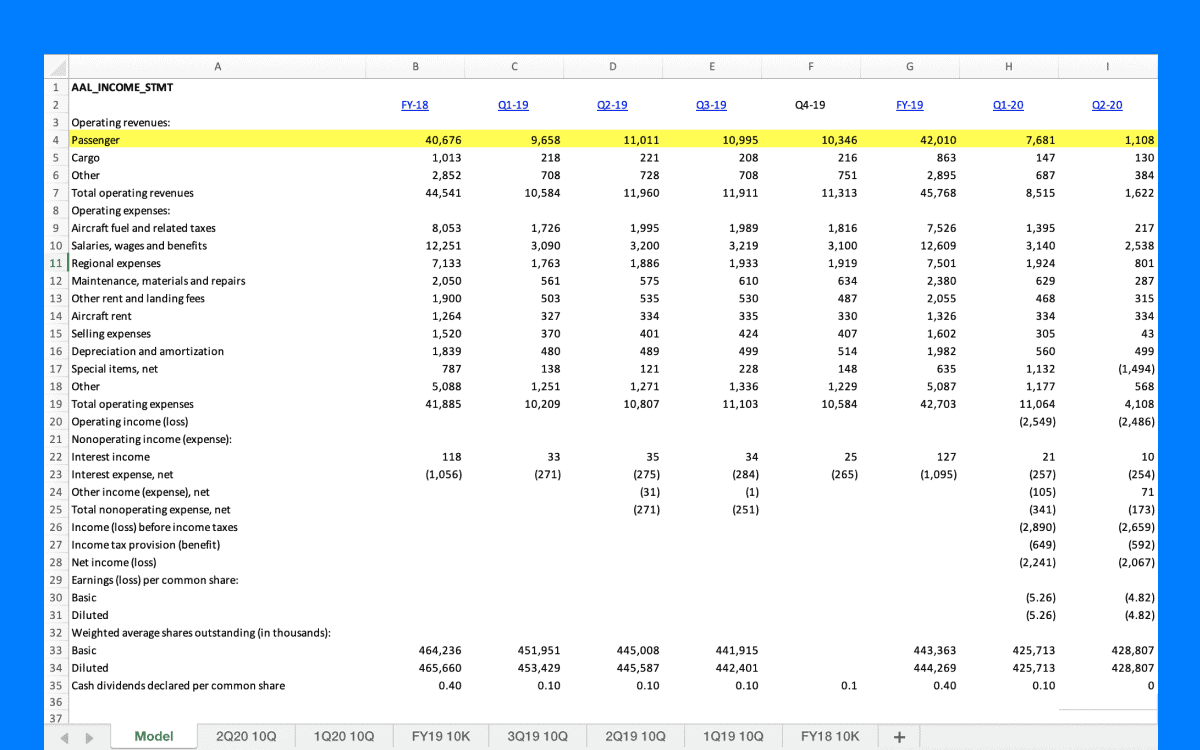
The modeled Income statement data, now in Excel, can be the foundation of your model or used for quick analysis.
In under a minute, we see that AAL passenger revenue was down by -90% year-over-year for Q2-2020. When AA reports passenger revenue in their next 10Q, this model can be updated in seconds with the new quarter of data.
To spend less time building models and extracting data, the table tools suite of modeling and extraction now includes clippers: clip and download tables and charts from ESG reports, global filings, and company presentations.
Login to AlphaSense to try the table tools suite or start your 2-week free trial and save time building models and extracting data from text.


