State of Market Intelligence
Read the report
Whether you’re trying to win new business, position your company for macroeconomic shifts, or simply beat the market, having a comprehensive strategy for monitoring competitors, trends, and the market is critical to doing your job successfully. But as the amount of available information grows exponentially, it becomes increasingly complicated to conduct competitive and market intelligence. As a result, most of your time and effort is spent on an endless cycle of information-gathering, rather than analyzing and taking action on valuable insights.
In our 2022 State of Market Intelligence Report, the nearly 600 professionals we surveyed agreed that it was difficult to stay on top of the competition when dealing with disparate sources of information and increasing amounts of noise:
- Only 33% of respondents consider their process to be proactive
- The majority of respondents use 3-6 tools for market intelligence research
- Over 90% of respondents have over 10 alerts set
This cognitive fatigue has a significant opportunity cost. Leveraging tools within AlphaSense can allow you to surface the most important information across companies, conquer information overload, and spend less time finding insights.
A Brief Overview of Monitoring on AlphaSense
When we speak to “monitoring” in the AlphaSense platform, we’re functionally talking about using tools like Dashboards and Alerts to stay on top of the most important new information about market trends, competitors, and macro-economic shifts. Both of these tools utilize AlphaSense’s powerful search technology to serve you curated, real-time content from 10,000+ public and proprietary sources. While Alerts are valuable for their ability to notify you of this new content, Dashboards allow you to put these insights into perspective.
In this article, we’ll focus on using dashboards to their full potential, as this tool is often the underused powerhouse of research workflows in AlphaSense.
Dashboards: Coverage at a Glance
Since clients use our monitoring tools to accomplish a number of different and nuanced jobs, our dashboard templates simply provide a skeleton for getting started, based on the fundamental level at which you need to monitor information:
Company | Monitoring a single company
Best for – In-depth, specific coverage on the company level
Watchlist | Monitoring a set of companies
Best for – Staying on top of of news about a core peer set, clinical trial progress across competitors, tracking new movements on portfolio companies
Industry | Monitoring an entire industry
Best for – Assessing market trends that affect specific industries, tracking a large competitive landscape at a high-level, staying on top of M&A activity
Custom | Monitor real-time results of a set of saved searches
Best for – Highly personalized feeds of information that are not necessarily set across a cohesive group of companies or industry
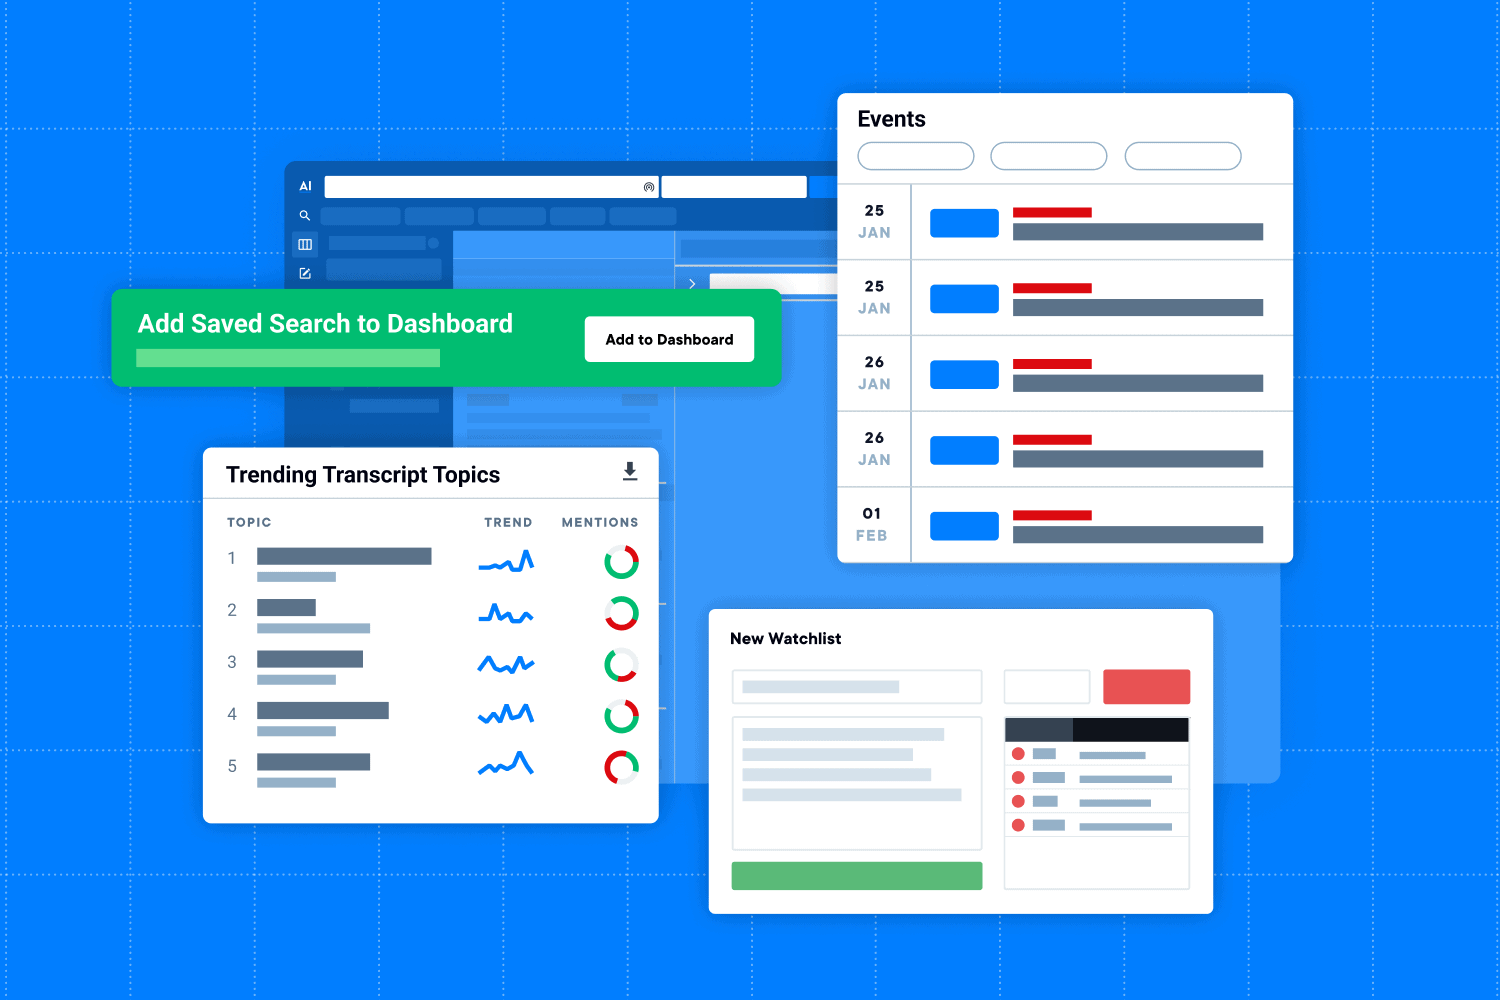
When leveraging one of the first three templates above, you’re automatically set up with a module that displays trending topics across all transcripts in the content set. For company and watchlist dashboards, you’ll also be able to access the Events Calendar module, which allows you to see upcoming and past events, and links directly to transcripts when available. The hero of our dashboards, though, are the information feeds from each of our four perspectives. They allow you to deepen your knowledge of companies, industries, and macroeconomic trends from the perspective of companies, thought leaders, journalists, analysts, investors, and experts.
This is the foundation for monitoring in AlphaSense–aggregating content from internal and external, subjective and objective voices as it hits the market, and serving you the most relevant information at a glance.
Sample Dashboards
Below, we’ll build dashboards together using some of our most popular use cases from AlphaSense customers.
Competitor Watchlist
For when you’re…launching a new product, benchmarking your results, updating company profiles, pivoting into a nascent market, or just trying to surface every signal from new and established competitors in your industry.
Step 1: Create and Refine your Watchlist
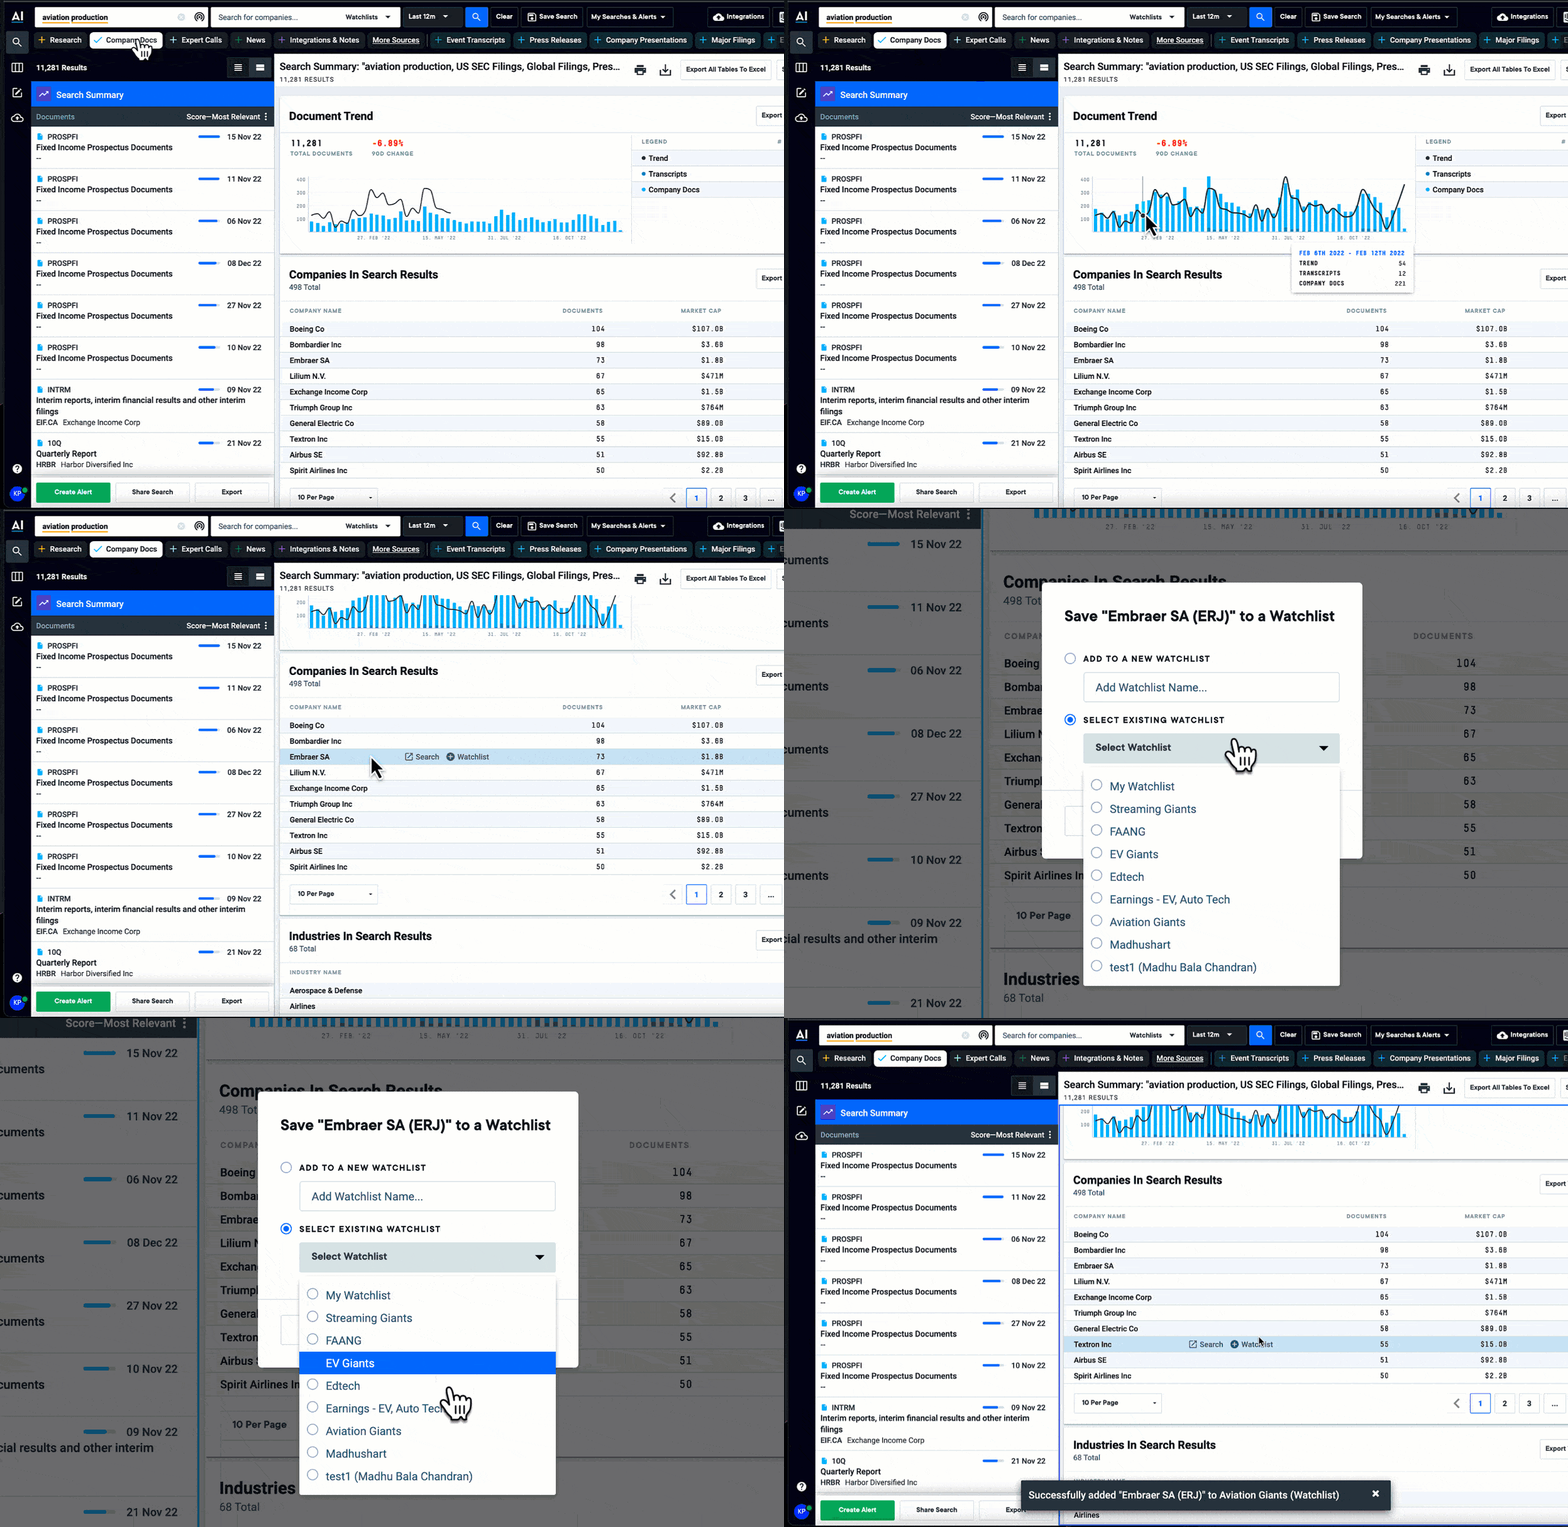
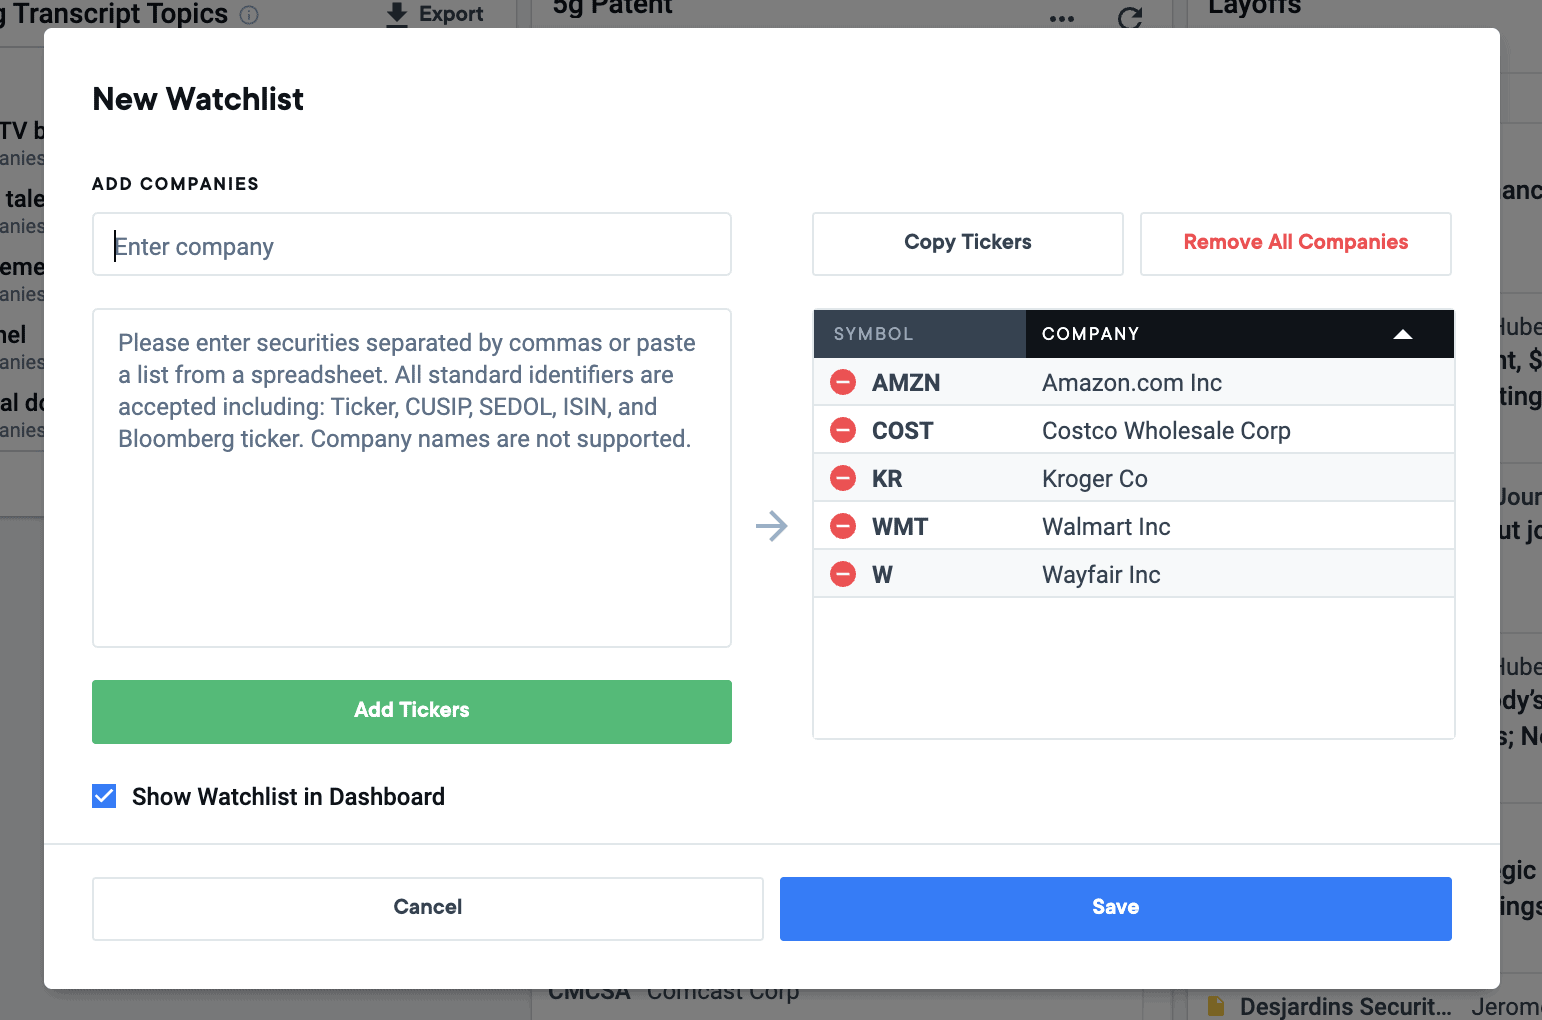
Add a new watchlist dashboard and add the names or ticker symbols of your competitors. You can gut-check your existing competitive list, or find off-radar competitors by searching a keyword or phrase relevant to your market research and filtering for “Company Docs”. This ensures you’re generating a list of companies talking about this topic or product category in press releases, earnings transcripts, events, and more. On the Search Summary page, you can quickly add any companies from the “Companies in Search Results” module to your existing watchlist.
Step 2: Determine the Top Trends to Track across Peer Set
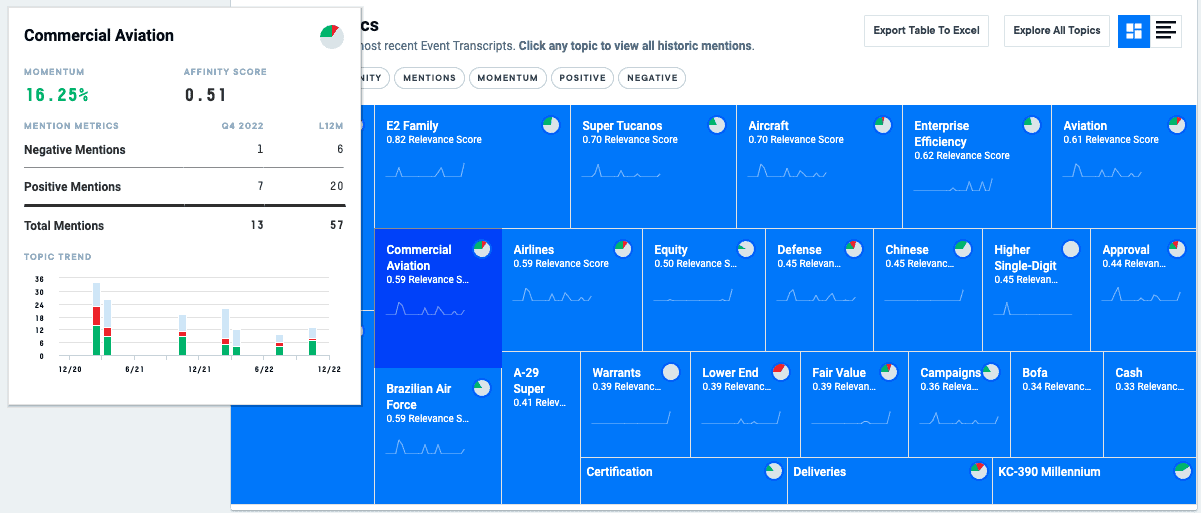
Establish the trends, topics, or benchmarks that you’d like to monitor across your competitive peer set. You can do this on an individual company level by leveraging the Company Topics module on our Entity Pages, or by using the Trending Topics module within your dashboard. Both of these tools use NLP to pull the most important, talked-about phrases across earnings calls, conferences, and other company presentations.
Pro tip: You can leverage our Search Library of the most popular searches by industry, theme, or company at any time; plus, learn more about how result-producing searches are constructed
Step 3: Add Relevant Searches to your Dashboard
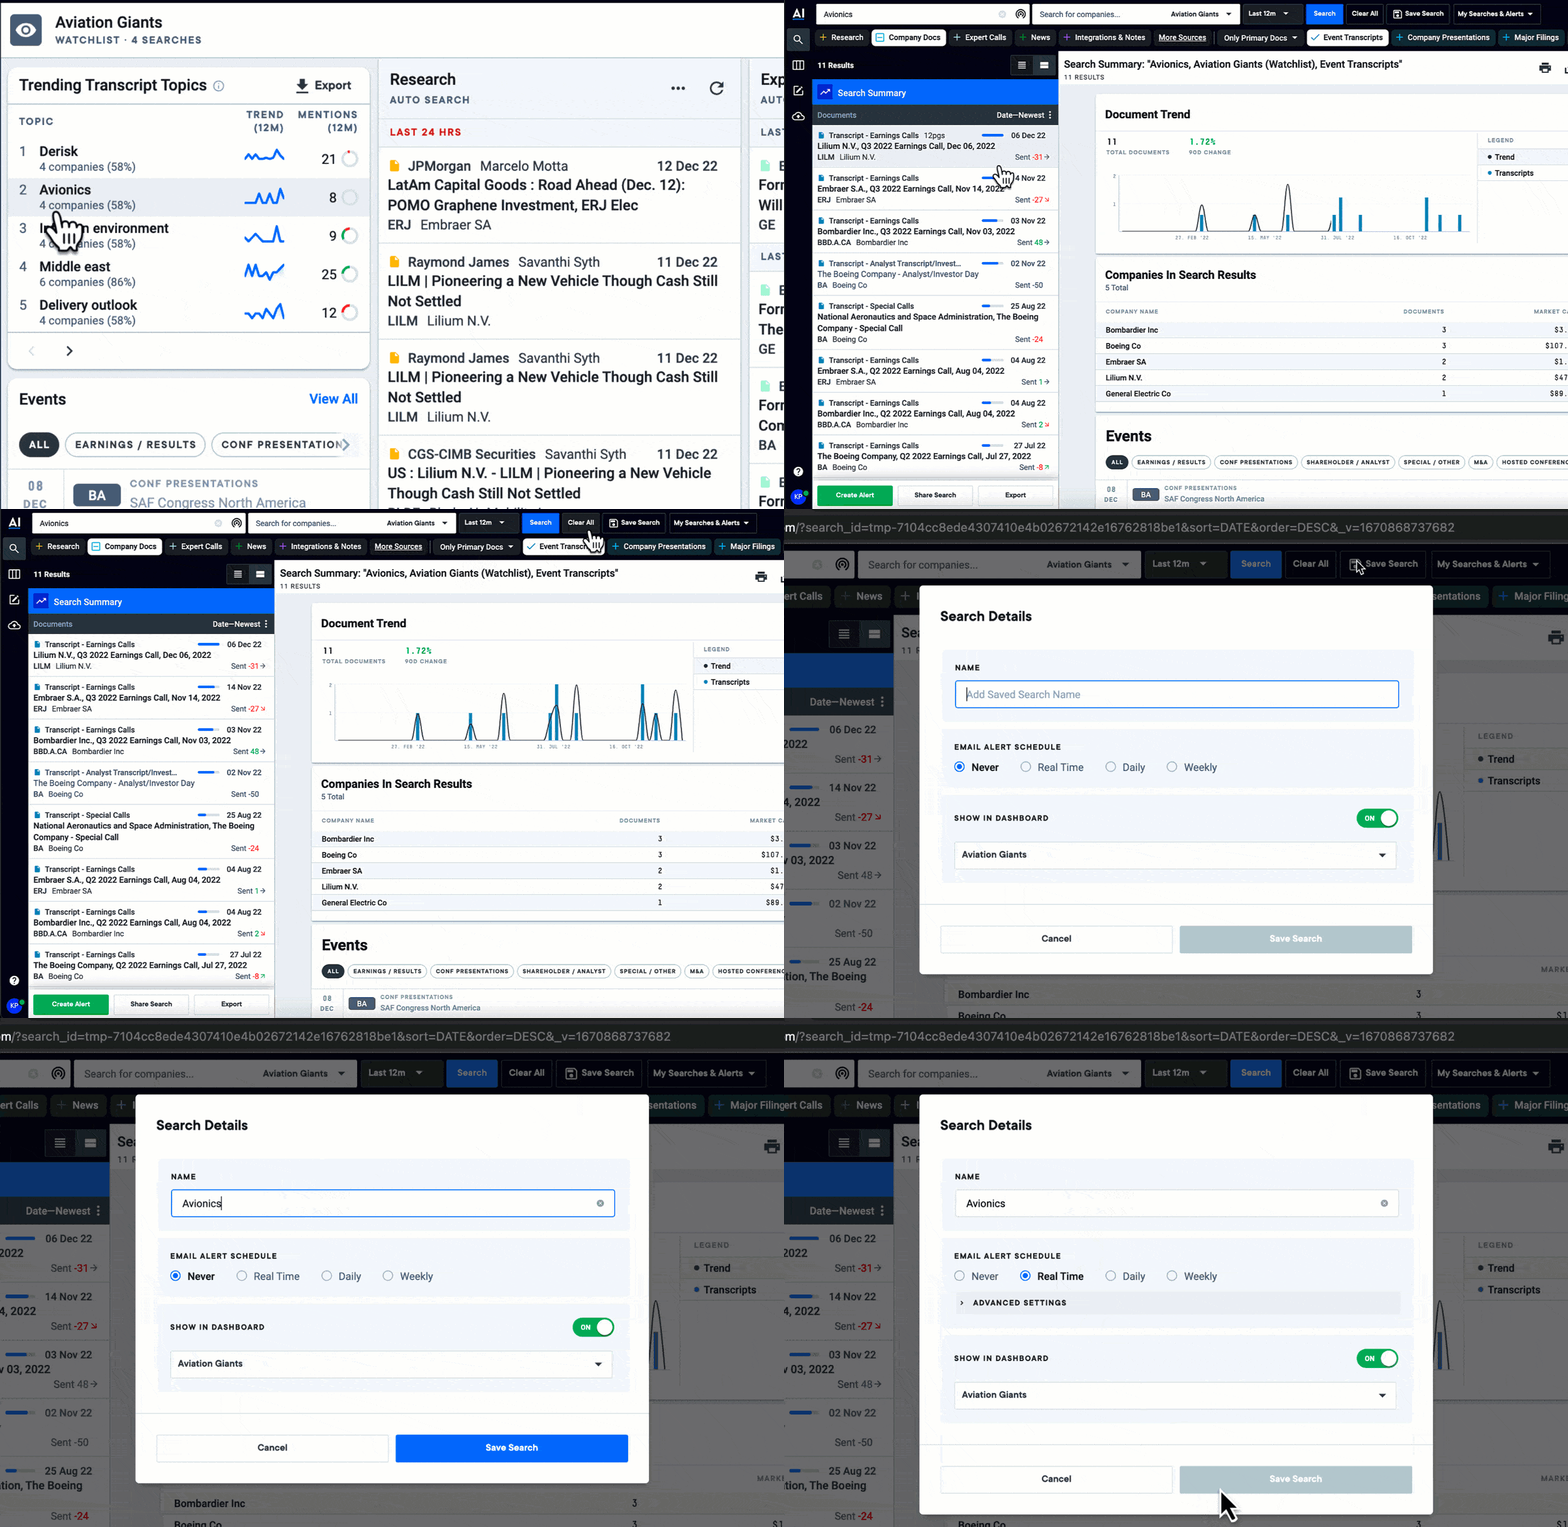
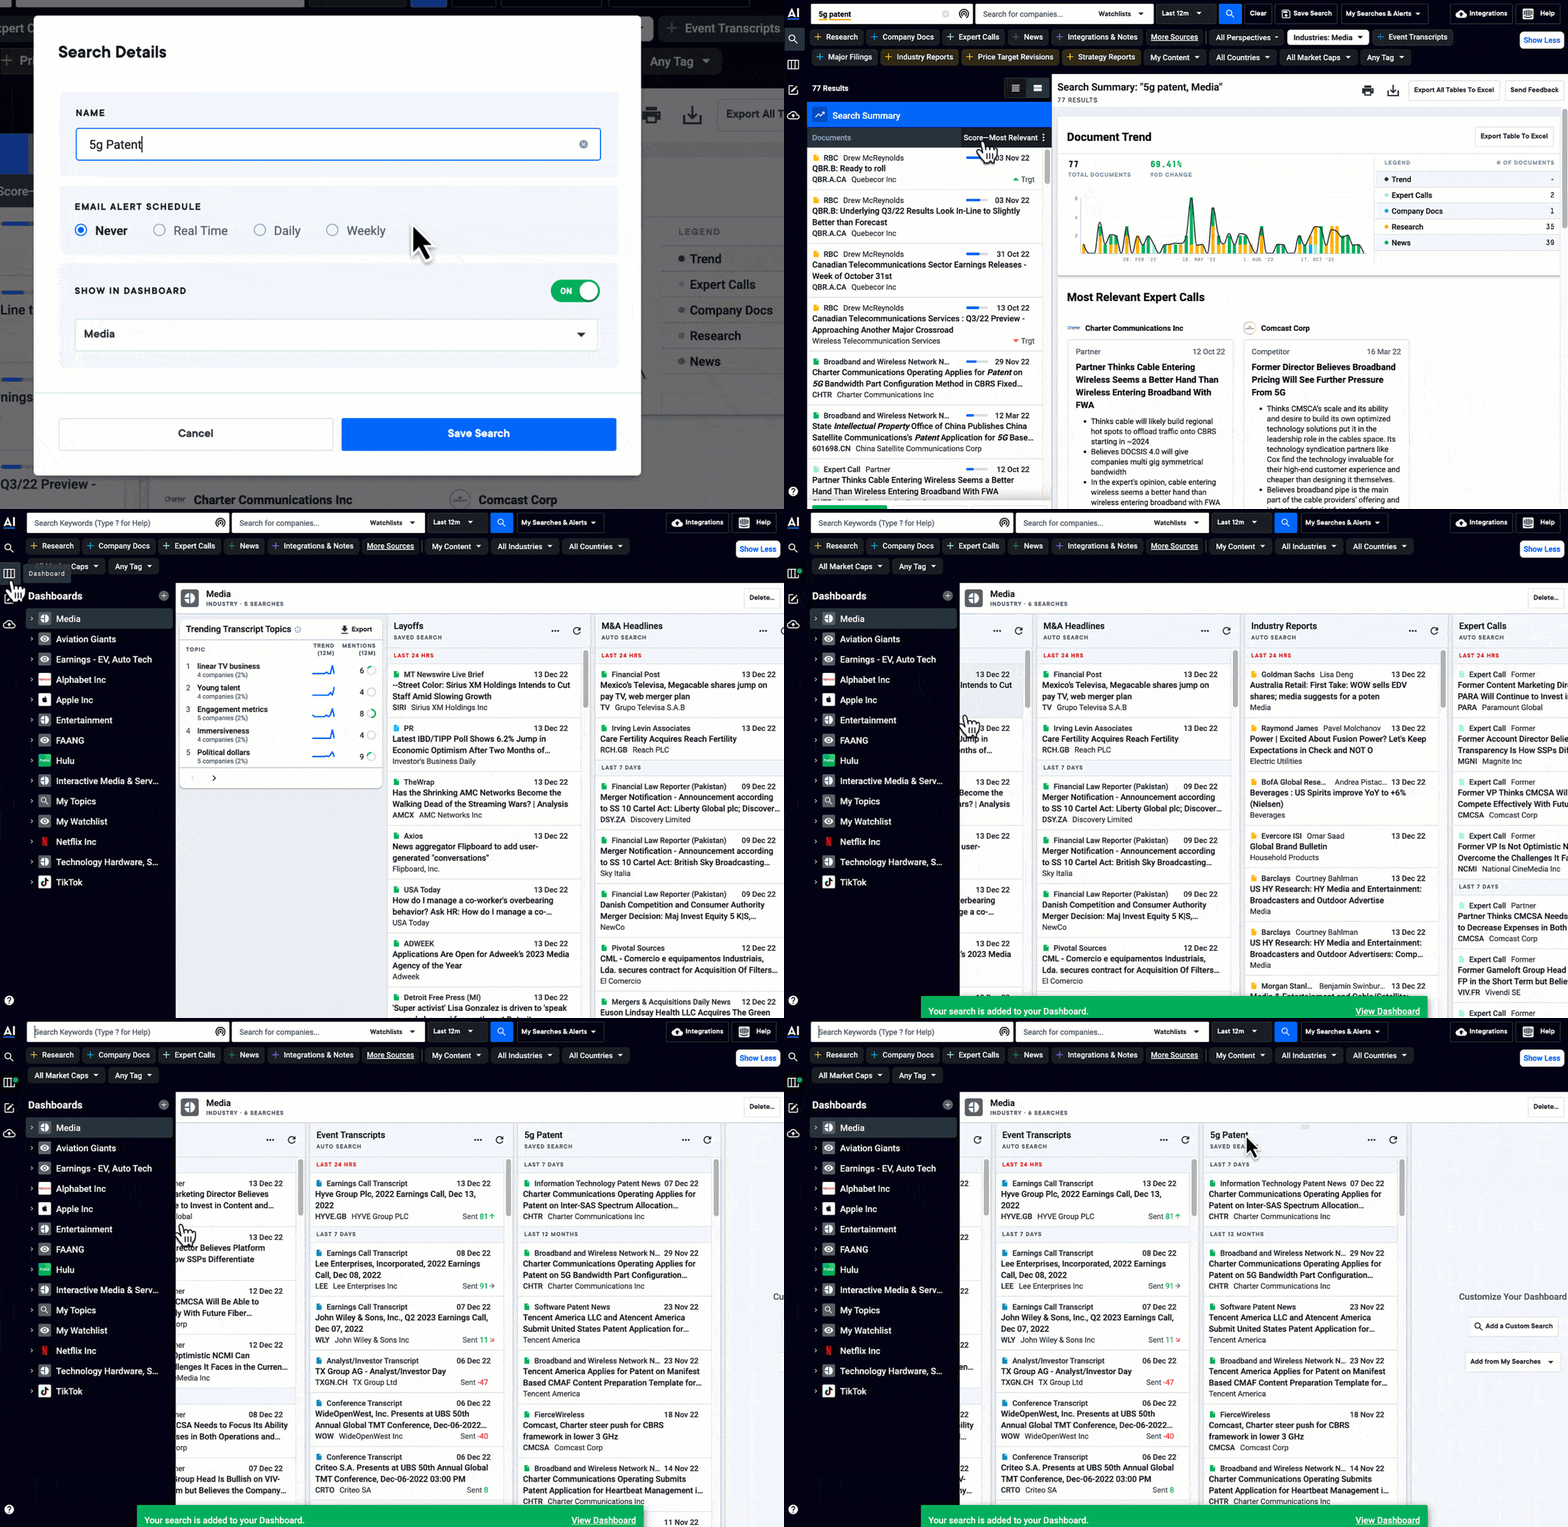
Run these trend- or topic-based searches across your watchlist and add any you would like to monitor to your dashboard by using the “Save Search” button. Here, you can also set up a cadence of alerts to ensure you never miss a thing, even when you’re not in-platform.
Earnings Prep (for Investor Relations)
For when you’re…trying to understand how competitors and peers are talking about the topics that matter most and prepare for possible questions analysts may ask on your quarterly earnings call
Step 1: Create a Dashboard and Add Earnings Feeds
Create a new watchlist dashboard and add the tickers of your peer set. Follow the links below to explore pre-built earnings searches popular with our IR customers, and make sure that you’re searching across the watchlist you’ve created. Add any of the following searches to your Earnings dashboard by clicking the “Save Search” button.
- Earnings Preview returns earnings-related press releases so that you can stay on top of new earnings call announcements or date movements
- Earnings Takeaways provides broker research reports that are focused on takeaways from earnings calls
- Earnings Docs covers all documents relevant to earnings season (i.e. SEC filings, Earnings calls, and Company presentations)
You can also add searches around key themes or topics you’re planning on covering in your earnings call, like “Supply chain”, “Layoffs”, or “Inflation”. These keyword searches help you nail your messaging in earnings materials by showing how your peers are tackling industry concerns in this quarter’s calls, while also giving context to how these conservations have evolved over time.
Step 2: Monitor Analyst Chatter
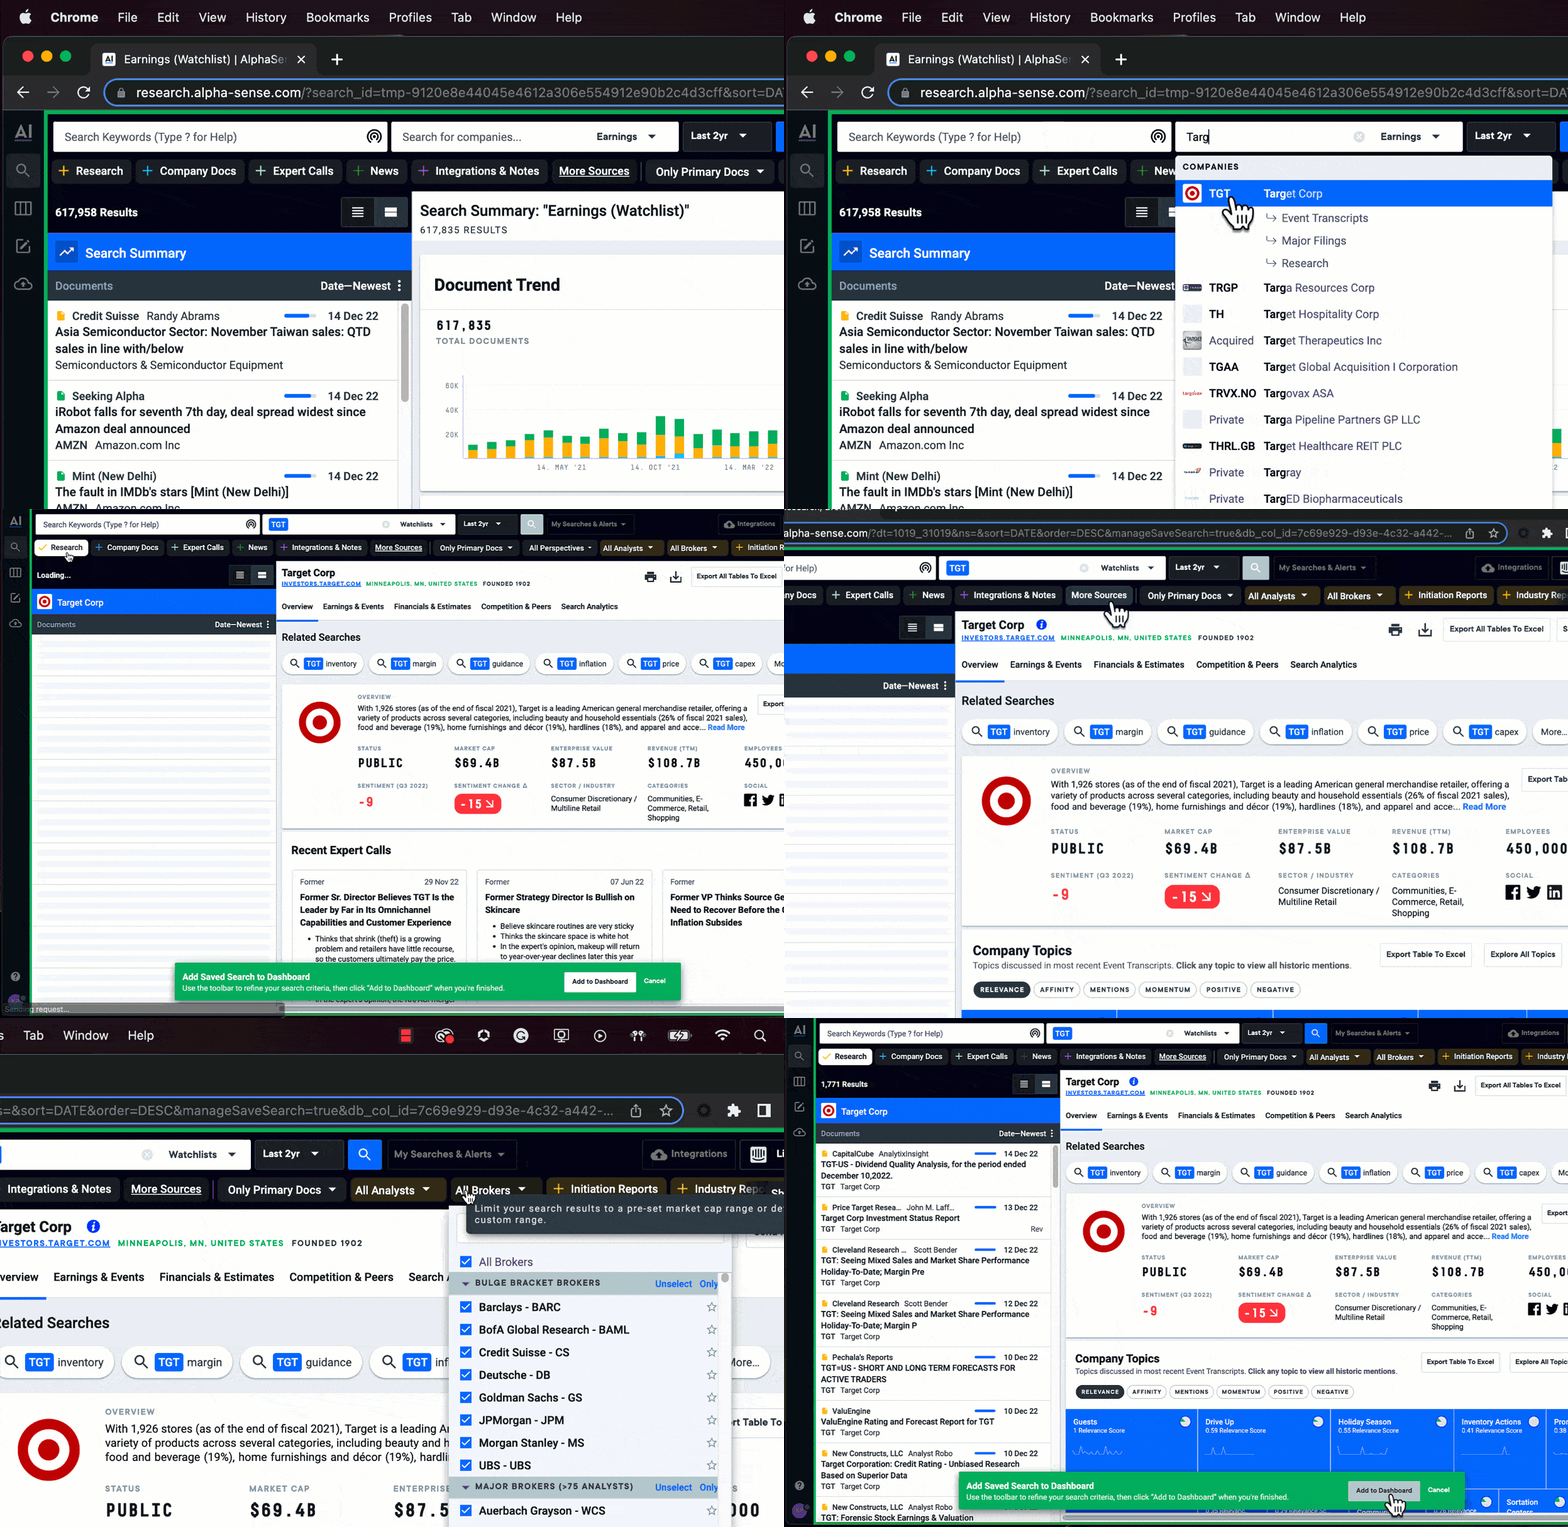
Add a saved search to track how analysts are talking about your company. Search for your company’s name and any key topics you would like to hone in on. You can filter further if you have specific brokers or analysts that you want to pay special attention to.
Step 3: Track Expert Sentiment around your Company
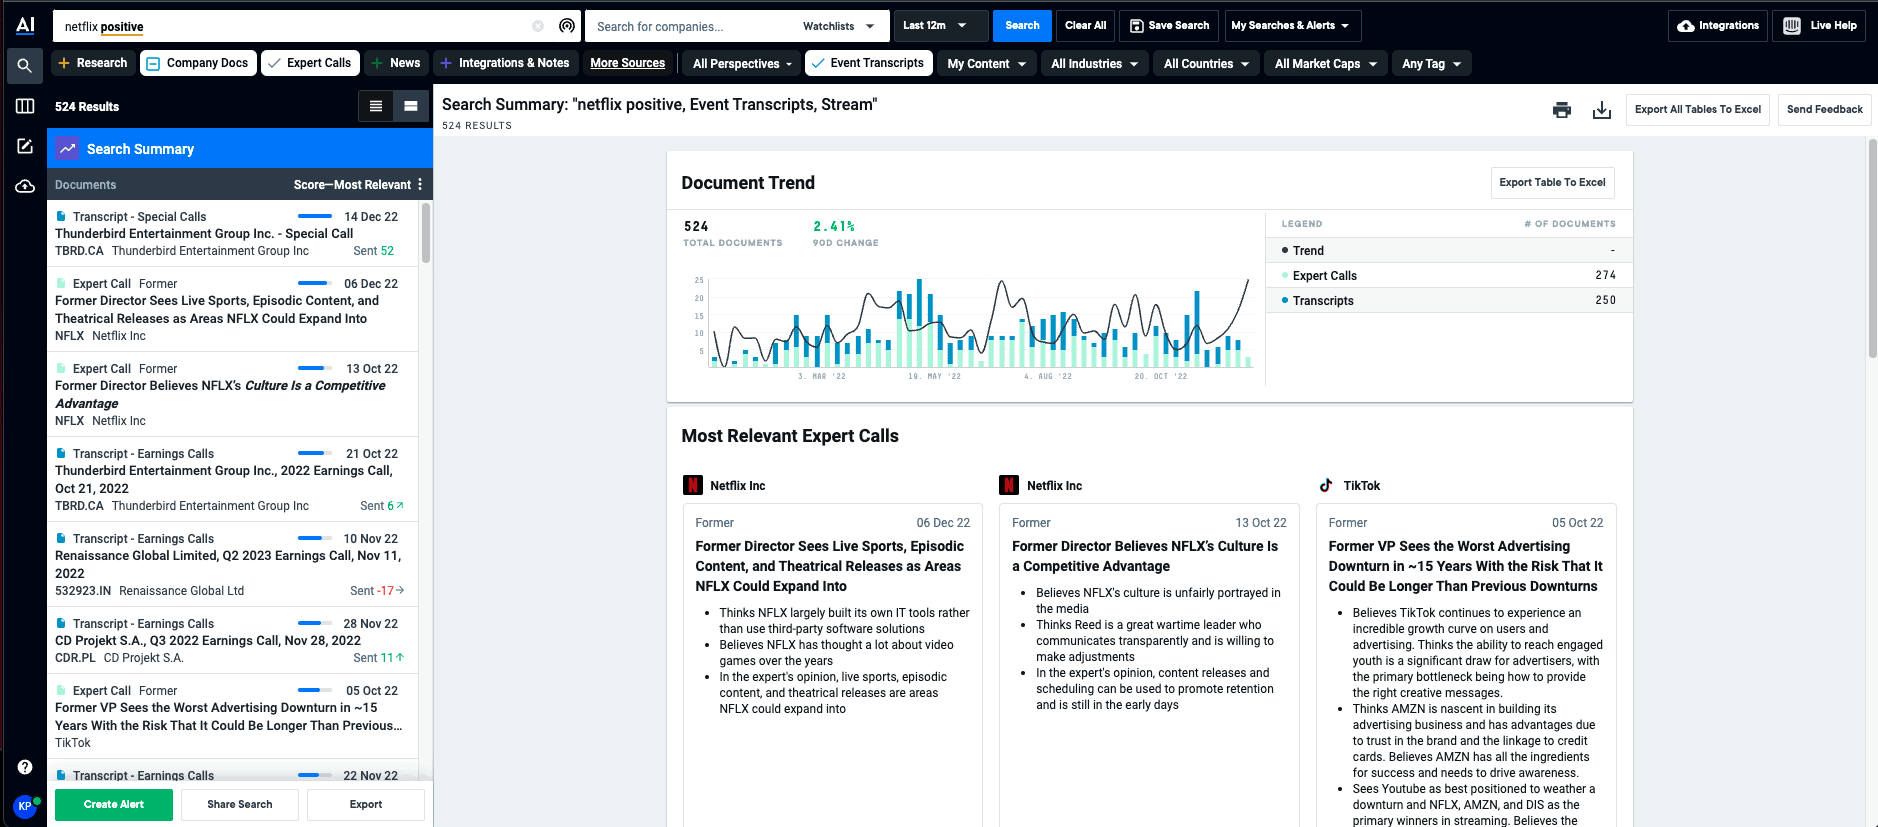
Use Boolean logic to search company mentions in our expert transcript library by positive or negative sentiment (i.e. “Netflix positive” for all positive mentions of Netflix, and “Netflix negative” for negative mentions). This will not only allow you to stay on top of any new expert interviews that emerge on our platform, but also quickly browse by sentiment score so you can focus on the transcripts that are most critical in preparation for earnings.
Investment Portfolio Trends
For when you’re…trying to stay on top of high-level macroeconomic trends that affect your investment portfolio.
Step 1: Create an Industry Dashboard
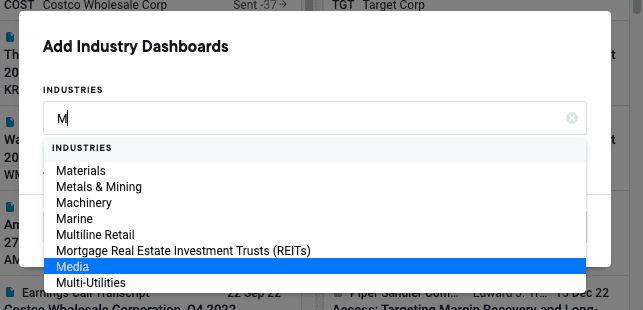
Add a new industry dashboard and choose the most relevant category for your portfolio from the dropdown menu. We’ll use an industry dashboard template so that we have access to the Trending Topics module, which is essential for monitoring emerging macro themes, especially during earnings.
Step 2: Add Trending Searches
You know the headwinds affecting your portfolio companies best–add the searches that are most relevant to your investments to your new dashboard. Need some inspiration? Leverage the industry articles in our Search Library (like this one on top searches for TMT companies).
Step 3: Reorganize to Find the Most Relevant Info Quickly
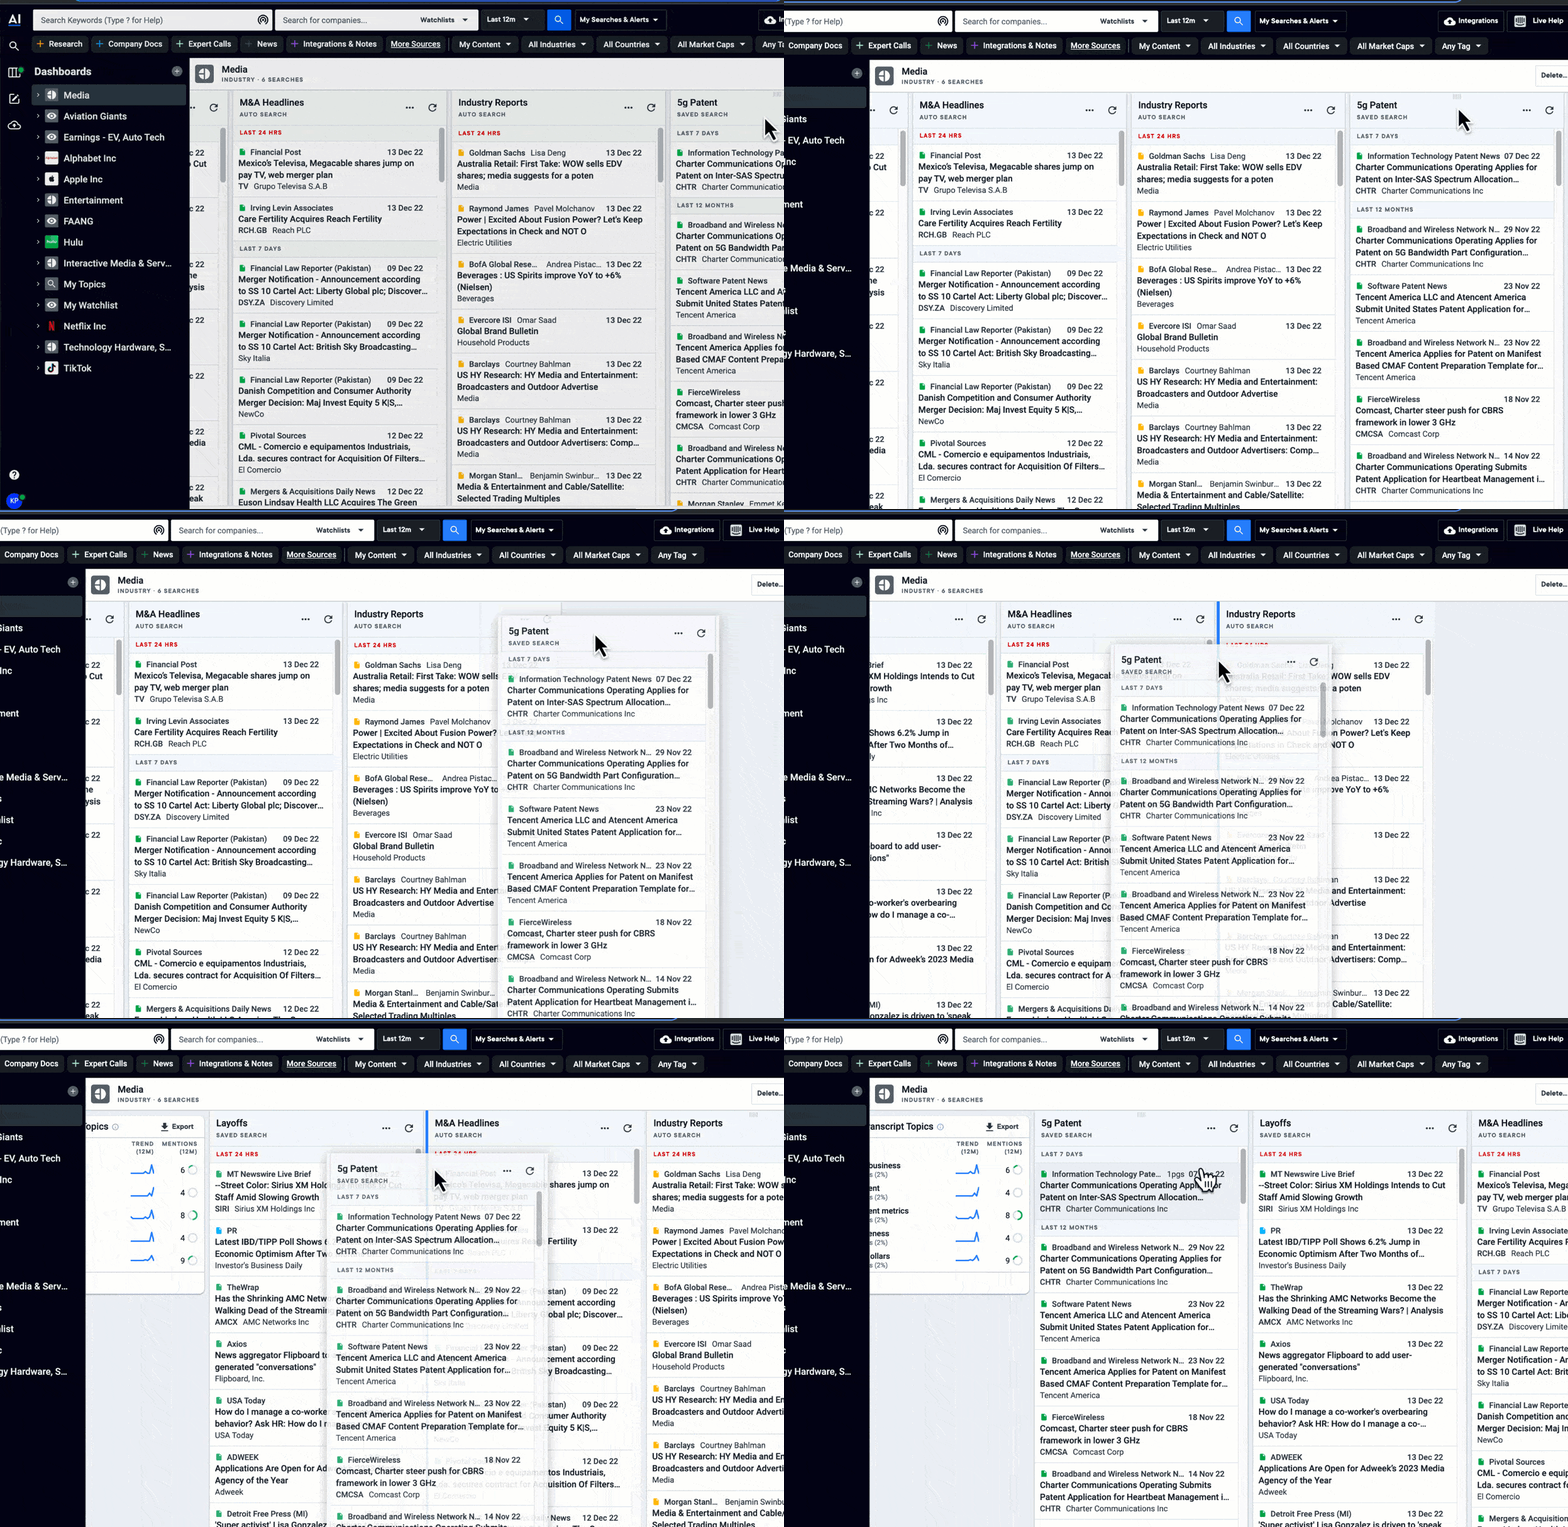
Drag your modules around to put the most important at the forefront, and hide any of the pre-built modules you don’t think are necessary.
When monitoring movements at a company, industry, or market level, it’s–of course– essential to have access to every piece of relevant information. However, that information is useless without a way to consume and validate these insights quickly. The examples above are just a few ways you can use dashboards in AlphaSense to aggregate and contextualize new information from across sources as it hits the market.
Don’t miss our Innovator’s Guide to Competitive Intelligence to take your strategy from reactive to proactive.
If monitoring companies is a critical part of your workflows, and you haven’t yet tried AlphaSense, start your free trial today.

